Without the federal tax credit, home solar still pays for itself well inside 25 years in most of the places we worked out, but more slowly. On our numbers, an 8 kW system bought for cash pays back in about 5 to 12 years in eight of nine US cities, if every kilowatt-hour it makes is worth the full retail price (Seattle takes 16). Where the utility pays little for the power you send back, it took roughly 9 to 20 years in our examples, and financing makes the gain smaller still. The 30% credit that used to cut those times ended for homeowner systems installed after 31 December 2025. This page shows the arithmetic, so you can redo it with your own bill. It belongs to our guides to solar costs and whether solar is worth it.
Three things decide the answer for your house: what you pay for the system, what your utility credits you for the power you export, and whether you pay cash. The tax credit is no longer one of them for a system you own. Leaf & Watt sells, installs and finances nothing, and takes no fees from installers.
Payback by city, worked out
The table takes one system, 8 kW of panels, and prices it in nine cities. 8 kW is the size of the representative home system in NLR’s Annual Technology Baseline. Each row uses three published figures:
- Price: EnergySage’s state average per watt, before incentives. EnergySage is a commercial quote marketplace, and these are averages of the quotes on it (state table updated 30 October 2026). Its average system sizes differ by state, so we use only its price per watt.
- Production: NLR’s PVWatts estimate for south-facing panels at a 20° tilt with 14% system losses, in kWh per kW per year. We ran it on 4 November 2026.
- Electricity price: the state’s average residential price for January to August 2026, from EIA’s Electric Power Monthly (released 23 October 2026).
| City | 8 kW price (EnergySage $/W) | kWh a year | Price per kWh | Value in year one, all at retail | Payback, no credit | Payback at $3.36/W |
|---|---|---|---|---|---|---|
| Los Angeles, CA | $20,160 ($2.52) | 13,408 | 32.58¢ | $4,368 | 4.6 years | 6.2 years |
| Boston, MA | $23,200 ($2.90) | 10,408 | 30.19¢ | $3,142 | 7.4 years | 8.6 years |
| Phoenix, AZ | $18,000 ($2.25) | 14,032 | 15.36¢ | $2,155 | 8.4 years | 12.5 years |
| Miami, FL | $16,960 ($2.12) | 12,400 | 15.32¢ | $1,900 | 8.9 years | 14.1 years |
| Denver, CO | $21,040 ($2.63) | 12,752 | 16.80¢ | $2,142 | 9.8 years | 12.5 years |
| Houston, TX | $18,000 ($2.25) | 11,360 | 16.03¢ | $1,821 | 9.9 years | 14.8 years |
| Chicago, IL | $23,440 ($2.93) | 10,456 | 19.23¢ | $2,011 | 11.7 years | 13.4 years |
| Raleigh, NC | $19,680 ($2.46) | 11,024 | 14.94¢ | $1,647 | 11.9 years | 16.3 years |
| Seattle, WA | $19,760 ($2.47) | 8,696 | 14.42¢ | $1,254 | 15.8 years | 21.4 years |
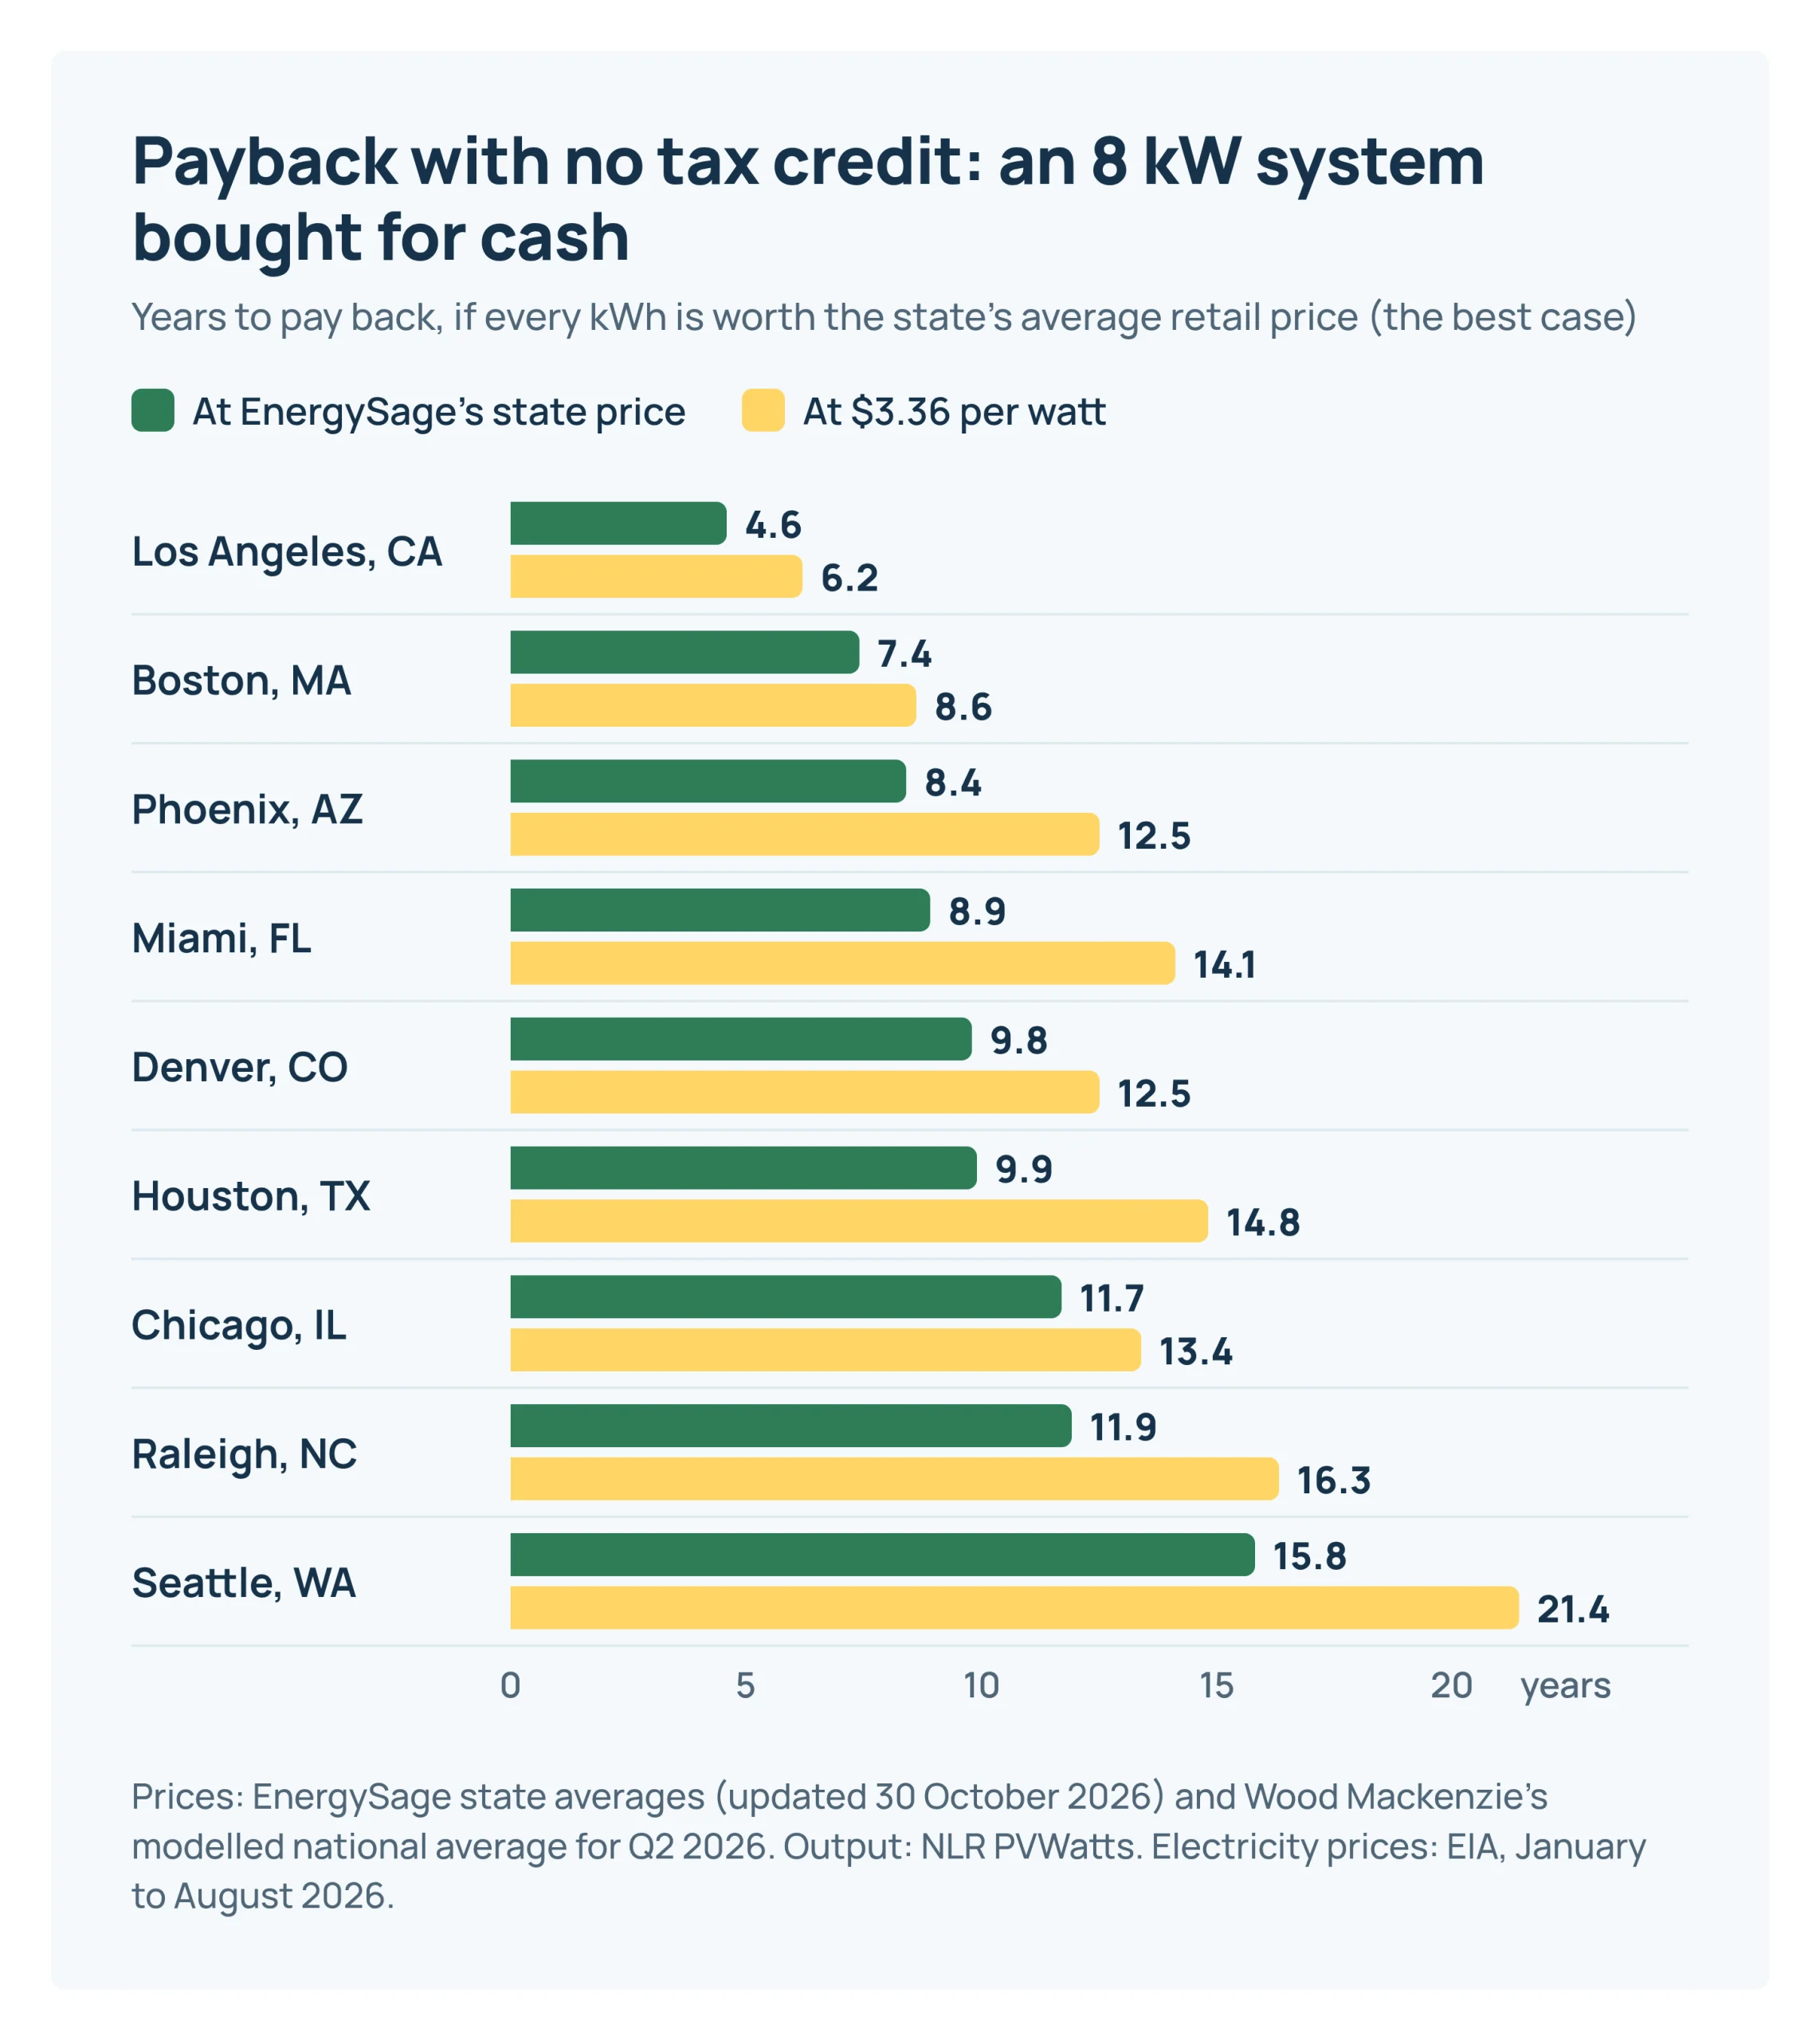
Read this table as a best case. It assumes every kilowatt-hour the panels make is worth the state’s average retail price. That holds only where net metering credits exports at the full rate and the system makes no more than the house uses in a year. It also uses EIA’s average price, which includes fixed monthly charges that solar can’t remove. Where exports earn less, payback gets longer, as the next sections show.
The last column reprices the same 8 kW system at $3.36 per watt ($26,880). That is Wood Mackenzie’s modelled national average for a turnkey home system in the second quarter of 2026, from its US Solar Market Insight Q3 2026 with SEIA. The figure is in the paid report, not on SEIA’s public page; we read it as reported by pv magazine on 24 September 2026. It comes from a cost model, not from quotes. Real prices spread widely. Berkeley Lab’s 2026 data update (August 2026) found that median prices across the top 100 home installers in 2025 ran from $2.4 to $6.3 per watt, leaving out apparent outliers. That is the up-front price before incentives, for systems the homeowner owns. So the price you’re quoted can move payback as much as the sunshine does.
The math, so you can use your own numbers
Simple payback is the installed price divided by what the system saves in a year:
- Production = system size in kW × kWh per kW per year from PVWatts for your address and roof.
- First-year savings = (kWh you use as it’s made × your price per kWh) + (kWh you export × what your utility credits for exports).
- Payback in years = installed price ÷ first-year savings.
Worked for Miami at full retail: 8 kW × 1,550 kWh = 12,400 kWh. 12,400 × $0.1532 = $1,900 a year. $16,960 ÷ $1,900 = 8.9 years.
Your bill gives you a better price figure than a state average. Divide the energy charges on a year of bills by the kWh used. Leave out the fixed customer charge, because solar doesn’t reduce it. If you’re on a time-of-use plan, the price that matters is the one for the hours the panels run. Our solar payback calculator does this arithmetic with your own price, export credit and quote.
What losing the tax credit changed
Through 2025, a homeowner who bought a system could take 30% of its cost off their federal income tax under section 25D. Public Law 119-21 added a cut-off to the statute: “The credit allowed under this section shall not apply with respect to any expenditures made after December 31, 2025” (26 USC 25D(h)). An expenditure counts as made “when the original installation of the item is completed” (25D(e)(8)). The IRS FAQ of 21 August 2025 says that paying in 2025 doesn’t help: if installation was completed after 31 December 2025, the credit is gone. Batteries a homeowner owns are covered by the same cut-off.
The IRS’s general credit page still mentions a phase-out “in 2033”. That line is out of date, and the statute controls. Our guide to what ended and what’s left of the solar tax credit goes through the details.
The credit took 30% off the net price, so any payback figure that still applies it is about 30% shorter than what a homeowner gets today. Some payback pages still online do this. Check whether a payback number you read, or one on a quote, takes 30% off the price.
Export credits decide a lot
Panels make most of their power at midday, when many homes use little. What your utility pays for that surplus often matters more than the price of the panels. Rules differ by state and by utility, and there is no national rule. Here is what the documents we read say, as of 4 November 2026. Our guide to net metering and net billing covers how these schemes work.
Florida: credits at the retail energy rate
For investor-owned utilities such as FPL, Florida’s net metering rule says excess energy “shall be credited to the customer’s energy consumption for the next month’s billing cycle” (Rule 25-6.065). Credits carry forward for up to 12 months. Credits still unused at the end of the year are paid at the utility’s as-available energy rate, which is lower. That puts a Florida system sized to the home’s yearly use close to the Miami row above. A system that makes more than the home uses earns much less on the surplus. Municipal utilities and co-ops set their own rules.
Arizona (APS): about a third of the retail price for exports
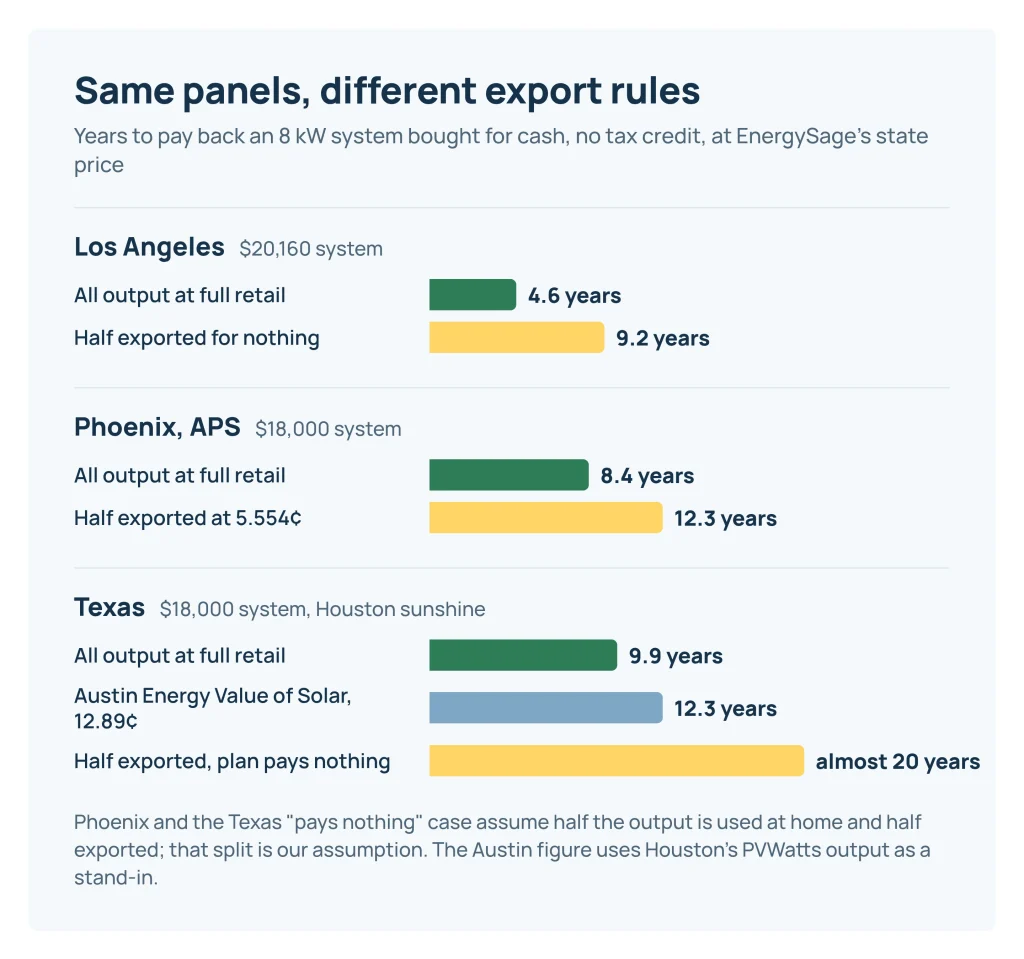
APS credits exported solar at $0.05554 per kWh for customers who submit an interconnection application between 1 September 2026 and 31 August 2027 and finish the installation within the tariff’s deadline. That rate then applies for 10 years from interconnection. Suppose half the Phoenix system’s 14,032 kWh is used in the house at 15.36¢ and half is exported at 5.554¢. That half-and-half split is our assumption, and your own share depends on when you use power. First-year savings come to $1,077.66 + $389.67 = $1,467. Payback stretches from 8.4 years to 12.3 at EnergySage’s price, or 18.3 years at $3.36 per watt. A battery, or moving loads like pool pumps and laundry to midday, raises the share you use yourself.
Texas: it depends on who sells you power
We found no statewide net metering rule in Texas. In the competitive retail areas, the credit for exports depends on your retail electricity plan, and each plan states its rate on its Electricity Facts Label. City utilities set their own terms. Austin Energy credits “100% of that production” at its Value of Solar rate of 12.89¢ per kWh (from 1 October 2026), and bills all the power you use separately. Excess bill credit carries over month to month, and Austin Energy recommends sizing a system to your yearly use. Using Houston’s PVWatts figure as a stand-in for Austin’s sunshine, that’s 11,360 × $0.1289 = $1,464 a year, a payback of 12.3 years at EnergySage’s Texas price of $18,000. Austin Energy also offers solar rebates, which this figure leaves out. In a competitive area, on a plan that pays nothing for exports, a system that exports half its output saves only the half used at home: 5,680 kWh × $0.1603 = $911 a year, a payback of almost 20 years. That is the floor. Our page on what solar costs in Texas goes plan by plan.
California: net billing
California’s large investor-owned utilities credit exports under the Net Billing Tariff. In SCE’s tariff, for example, export credits come from an avoided-cost calculator with prices that vary by hour, month and day type. For systems that get permission to operate by the end of 2027, those prices are fixed for nine years. There’s no single export rate in cents. The Los Angeles row uses a downtown location, but the city itself is served by LADWP, a city-owned utility that sets its own rules; SCE serves much of the surrounding region. The two limits still show the range: at full retail, the Los Angeles system pays back in 4.6 years. With half its output exported for nothing, it takes 9.2. Unless export credits beat the retail price, payback lands between those two limits. A battery lets the house use more of its own power instead of exporting it. See California solar under net billing, and what solar costs in California for the state’s published prices.
Virginia (Dominion): a change for new systems in 2027
The State Corporation Commission’s order in case PUR-2025-00079 keeps netting over a yearly period for Dominion customers. It credits any excess left at the end of the year at $0.05829 per kWh and adds a $1.00 monthly charge (order on clarification, 20 May 2026). It applies to new or modified interconnections from the first month at least 12 months after the 30 April 2026 order, which by our arithmetic is about May 2027. It doesn’t apply to low-income customers. In practice, a new system that makes more than the home uses in a year earns much less on the surplus.
Cash, loan or lease
Cash gives the paybacks above. One way to compare with other uses of the money: first-year savings divided by price. In Miami, that’s $1,900 ÷ $16,960 = 11.2% in year one, falling slowly as the panels age and changing with electricity prices.
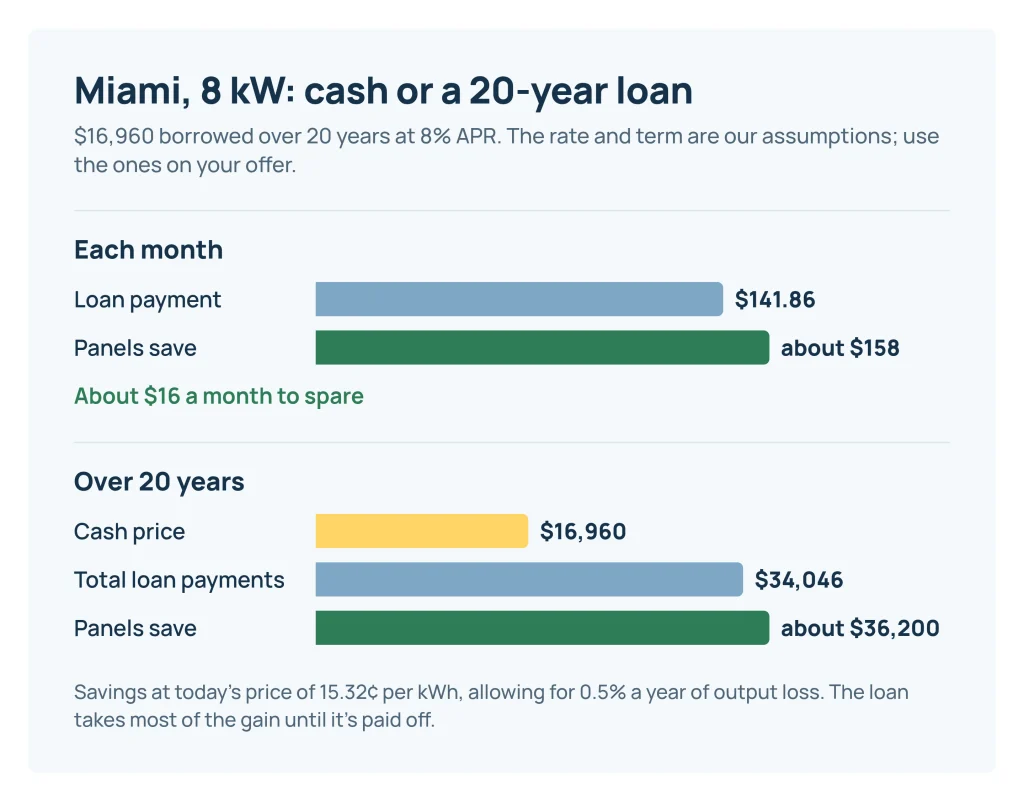
A loan adds interest. As an example, take $16,960 borrowed over 20 years at 8% APR. The rate and term are our assumptions; use the ones on your offer. That’s $141.86 a month, or $1,702 a year. The Miami system saves about $1,900 a year, or $158 a month, so the savings cover the payment with about $16 a month to spare. Over the 20 years you pay $34,046, and the panels save about $36,200 at today’s price, allowing for 0.5% a year of output loss. The loan takes most of the gain until it’s paid off. Berkeley Lab also found that loan-financed systems were “considerably higher priced” than cash purchases in 2025, “potentially due in part to loan origination fees rolled into the up-front price” (same 2026 data update). Ask for the cash price and the loan price side by side, and ask whether the loan price includes a dealer fee.
A lease or power purchase agreement changes the tax picture. The company that owns the panels may still be able to claim the business credit in 26 USC 48E. You can’t claim it, and it’s the provider’s credit. Whether any of its value reaches you through a lower monthly price is a question for the contract. For solar under 48E, the statute has a cut-off for systems placed in service after 31 December 2027, with exceptions tied to when construction began. Ask the provider in writing how its price reflects the credit, and what the escalator, buyout and house-sale terms are. Our page on solar leases, PPAs, loans and cash compares them.
Over 25 years
Panels lose a little output each year. NREL’s 2012 review of nearly 2,000 published degradation rates, measured in the field on single modules and whole systems, found a median loss of 0.5% a year (Jordan and Kurtz, 2012). At that rate, 25 years of output add up to about 23.6 times the first year’s.
| Miami example, cash, 25 years | Value of output | Minus price |
|---|---|---|
| Electricity price stays at 15.32¢ | $44,749 | $27,789 |
| Price rises 2.7% a year | $62,318 | $45,358 |
We chose 2.7% because it’s the rise EIA forecasts for the US average residential price from 2026 to 2027, 18.2¢ to 18.7¢ per kWh, in its Short-Term Energy Outlook of 6 October 2026. EIA doesn’t forecast 25 years ahead at that level, so the second row is a what-if, not a forecast. Neither row is discounted for the time value of money, and neither includes the costs below.
- Inverters. Compare the inverter’s warranty term on the quote with the panels’. If it’s shorter, budget for a replacement.
- Your roof. If the roof will need replacing within the system’s life, the panels must come off and go back on. Ask the installer for that removal-and-reinstall price in writing. If the roof is near the end of its life, replacing it first means paying for removal only once.
- Moving. Payback assumes you stay long enough to collect the savings. See the home value section below.
- Rule changes. Export terms can change for new customers. Some, like APS’s and California’s, lock a rate for a set number of years. Others don’t. Ask your utility what applies to you and for how long.
For how long panels, inverters and batteries tend to last, see how long solar panels last.
When solar tends to pay, and when it doesn’t
From the arithmetic above, solar without the credit tends to pay off when most of these are true:
- You pay a high price per kWh. At about 30¢, each kWh in California or Massachusetts is worth twice what it is in a 15¢ state.
- Your utility credits exports at or near retail, or you use most of the power as it’s made.
- The roof faces roughly south, west or east, isn’t shaded, and won’t need replacing for years.
- You can pay cash, or borrow at a rate well below your first-year return.
- You expect to stay in the house for longer than the payback.
It tends not to pay off when power is cheap and the sun is weak, as in the Seattle row. It also struggles when exports earn little and you’re out all day, when a dealer-fee loan inflates the price, or when the roof is shaded or due for replacement. In Berkeley Lab’s 2025 data, roughly 60% of the top 100 installers had median prices below $4 per watt. At $4 or more, every row in the table gets much longer.
Does solar raise home value?
The study most often cited is old. Berkeley Lab’s Selling Into the Sun (January 2015) looked at 22,822 home sales in eight states, 3,951 of them with solar, from 2002 to 2013. It found average premiums of about $4 per watt, roughly $15,000 for the typical 3.6 kW system of the time. Those sales are now 13 to 24 years old, so the study says little about what buyers pay for solar today. A leased system is different again, because the lease contract sets what happens when the house is sold.
What to check in a quote
- System size in kW DC, panel and inverter models, and the price per watt (total price ÷ watts).
- The cash price, and separately the loan price, with any dealer fee shown.
- The production estimate in kWh a year, and the tool and shading assumptions behind it. Compare it with your own PVWatts run.
- Which export tariff the savings assume, and the rate used. Check it against your utility’s tariff.
- Whether any savings figure includes a federal tax credit. For a system you own, installed in 2026, it shouldn’t.
- Panel, inverter and workmanship warranty terms, and who honours them if the installer closes.
- The roof removal-and-reinstall price, and who handles the permit, inspection and utility interconnection agreement.
Don’t let a system be switched on before the permit, inspection and utility interconnection approval your area requires. A licensed installer or electrician does the wiring.
Sources and notes
Installed prices here are published estimates from a quote marketplace, an industry model and a national lab. We show them side by side and don’t average them. Production comes from PVWatts runs for a city centre, which your roof’s direction, tilt and shade will change. The 8 kW size, the half-and-half split between use and export, and the loan terms are our assumptions. How we estimate explains our method. Your utility decides export credits, and a tax professional can say what applies to your own taxes. This page is general information, not professional, tax, legal or financial advice.
Sources checked on 4 November 2026.
Sources
- 26 USC 25D, Residential clean energy credit (Cornell LII)
- IRS FS-2025-05: FAQs on Public Law 119-21 changes to 25C, 25D and other credits (21 August 2025)
- 26 USC 48E, Clean electricity investment credit (Cornell LII)
- EnergySage: Solar panel cost by state (state table updated 30 October 2026; commercial quote marketplace)
- SEIA and Wood Mackenzie: US Solar Market Insight Q3 2026
- pv magazine: U.S. solar system pricing rises for utility and commercial projects as residential costs decline (24 September 2026; reports the Wood Mackenzie Q2 2026 figures)
- Berkeley Lab: U.S. Distributed Solar and Storage, 2026 Data Update (August 2026)
- NLR Annual Technology Baseline 2025: Residential PV
- NLR PVWatts Calculator (version 8; runs of 4 November 2026)
- EIA Electric Power Monthly, Table 5.6.B, average residential price year to date (released 23 October 2026)
- EIA Short-Term Energy Outlook, electricity (6 October 2026)
- Florida Administrative Code Rule 25-6.065, Interconnection and net metering of customer-owned renewable generation
- APS Rate Schedule RCP, Resource Comparison Proxy export rate
- Austin Energy: Value of Solar rate (effective 1 October 2026)
- SCE Schedule NBT, Net Billing Tariff
- Virginia SCC, Case PUR-2025-00079, order on clarification (20 May 2026)
- Jordan and Kurtz, Photovoltaic Degradation Rates: An Analytical Review (NREL, 2012)
- Berkeley Lab: Selling Into the Sun, price premium analysis of solar homes (LBNL-6942E, January 2015)