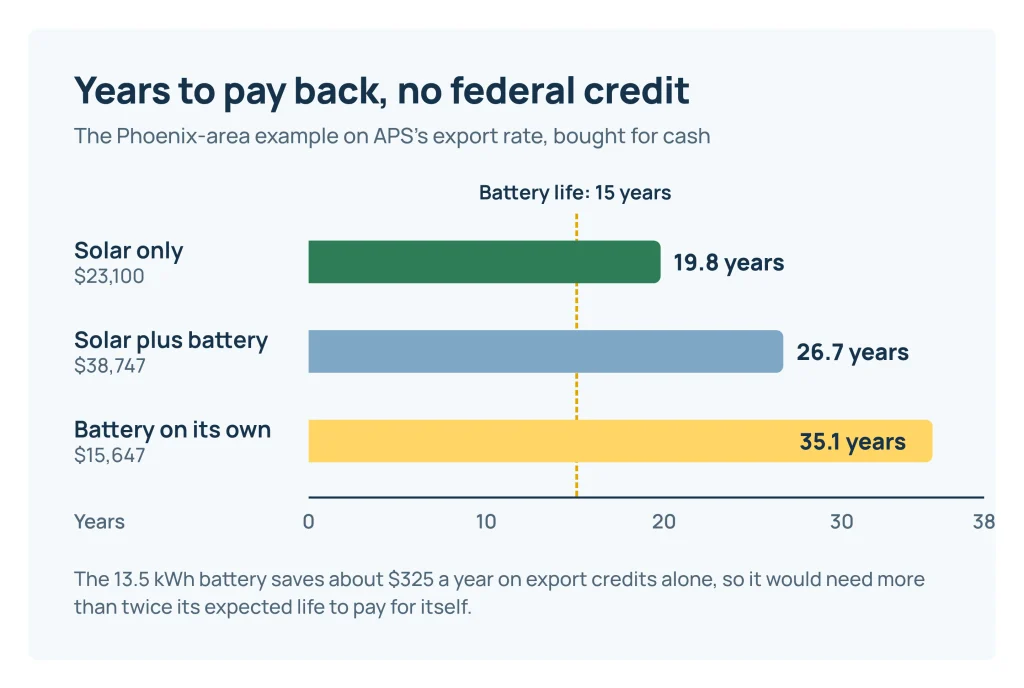
Our example house is in the Phoenix area and gets APS’s current export rate. A 7.7 kW system bought for cash at $3.00 a watt ($23,100) takes about 19.8 years to pay for itself with no federal tax credit. Adding a 13.5 kWh battery at $15,647 stretches the payback of the whole package to about 26.7 years. On its own, the battery would need about 35 years, more than twice its expected life. Your answer depends on your rate, how much of your solar you use as it’s made, and what your utility pays for the rest. The calculator on this page runs the same math on your numbers. For prices, rates and whether solar suits your house, see our solar costs and payback guides.
Every figure on this page assumes no federal homeowner credit, because 26 USC 25D(h) ended it for expenditures made after 31 December 2025. An expenditure counts as made when installation is completed, so payback figures that take 30% off the price no longer apply to a system you buy. Leaf & Watt sells and installs nothing.
What to enter
You need four things from your own paperwork. The rest have dated defaults you can change.
- Your rate. Divide the energy charges on a recent bill by the kWh used. Fixed monthly charges don’t fall when you add solar, so leave them out. The default, $0.1536 per kWh, is Arizona’s average residential price for January to August 2026 from EIA’s Electric Power Monthly (released 23 October 2026). It’s an average of all charges and all utilities, so your own rate can be quite different.
- Your yearly use. Add up 12 months of bills. The default, 12,900 kWh, is Arizona’s 2024 average of 1,075 kWh a month (EIA Table 5A).
- Your export credit. Your utility’s tariff says what it pays for each kWh you send to the grid. The default is APS’s rate for interconnection applications from 1 September 2026 to 31 August 2027: $0.05554 per kWh under Rate Rider RCP, locked for 10 years from interconnection. It applies only to APS customers; SRP and TEP set their own terms. Under classic net metering, enter your full rate instead. Our guide to net metering and net billing explains the difference.
- The quote. System size in kW (DC), the price before incentives, and the installer’s first-year production estimate. If there’s a battery, use its usable kWh and its line on the quote.
No quote yet? The production default comes from a run of NLR’s PVWatts (v8) on 4 November 2026: 1,754 kWh a year per kW of panels in Phoenix, facing south at a 20° tilt with 14.08% system losses. The same settings give 1,550 kWh in Miami, 1,420 in Houston, 1,307 in Chicago and 1,087 in Seattle. Your roof’s direction, tilt and shade change these numbers, so run PVWatts for your own address.

The example, worked through
These are the calculator’s defaults. Every number in the right-hand column can be checked by hand.
| Step | Working | Result |
|---|---|---|
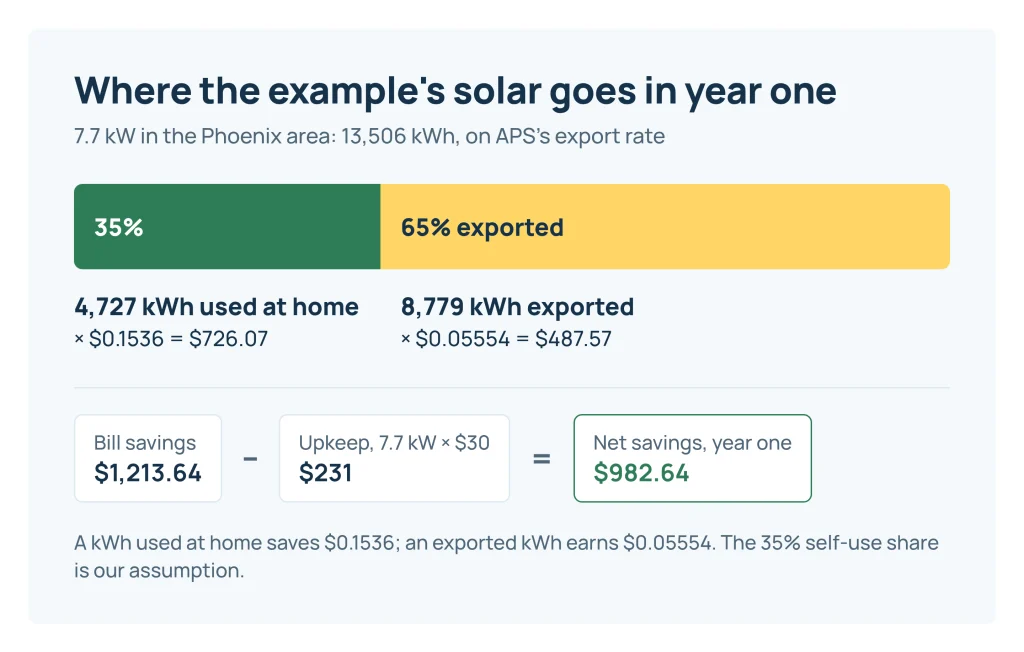
| Solar output, year one | 7.7 kW × 1,754 kWh | 13,506 kWh |
| Used at home as it’s made | 35% of 13,506 kWh | 4,727 kWh |
| Exported | 13,506 − 4,727 | 8,779 kWh |
| Bill savings, year one | 4,727 × $0.1536 + 8,779 × $0.05554 | $726.07 + $487.57 = $1,213.64 |
| Upkeep, year one | 7.7 kW × $30 | $231 |
| Net savings, year one | $1,213.64 − $231 | $982.64 |
| Price | 7,700 W × $3.00, no credit | $23,100 |
| Yearly change in savings | 1.025 (rate rise) × 0.993 (panel output loss) | +1.78% a year |
| Solar-only payback | Formula below | 19.8 years |
| Net gain over 25 years | Sum of 25 years of savings − $23,100 | $7,515 |
Now add the battery. It holds 13.5 kWh, the median size paired with home solar in 2025 according to LBNL’s 2026 data update (mostly California data), and it costs $15,647, EnergySage’s typical price for that size before incentives. Both sources are in the price table below.
| Step | Working | Result |
|---|---|---|
| Energy delivered to the house a year | 13.5 kWh × 80% average capacity × 330 days | 3,564 kWh |
| Solar it takes to deliver that | 3,564 ÷ 0.89 round-trip efficiency | 4,004 kWh |
| Bill saved in the evening | 3,564 × $0.1536 | $547.43 |
| Export credit given up | 4,004 × $0.05554 | $222.41 |
| Battery savings, year one | $547.43 − $222.41 | $325.02 |
| Battery’s own payback | $15,647 against $325.02 a year, growing 1.78% | 35.1 years (life: 15) |
| Battery net gain over its 15 years | Sum of 15 years of savings − $15,647 | −$10,114 |
| Payback, solar plus battery | $38,747; battery savings stop after year 15 | 26.7 years |
With the battery, about 65% of the solar is used at home instead of 35%. That sounds like a big gain, but each kWh moved from export to evening use is worth only $0.1536 − ($0.05554 ÷ 0.89) ≈ $0.091. That’s why the battery takes so long to pay for itself here. The case for a battery in this house rests on backup power, a time-of-use rate or a utility program, not on export credits alone.
The formula
Savings in year one are what the solar saves on your bill, minus upkeep:
- Used at home = the smaller of (output × your self-use share) and your yearly use
- Savings = used at home × your rate + exported × export credit − kW × upkeep per kW
- Each year, savings change by q = (1 + rate rise) × (1 − output loss)
- Payback in years = ln(1 + price × (q − 1) ÷ first-year savings) ÷ ln(q)
For the example: 23,100 × 0.017825 ÷ 982.64 = 0.419, and ln(1.419) ÷ ln(1.017825) = 0.3500 ÷ 0.01767 = 19.8 years. If q is exactly 1 (no rate rise, no output loss), payback is simply price ÷ savings. If savings don’t add up to the price within 50 years, the calculator shows 50. Read 50 as “doesn’t pay back on these numbers”. With the battery unticked, the battery lines show 0.
The battery delivers the smallest of three amounts: usable kWh × average capacity × days it fills, the evening use your solar doesn’t already cover, and what your exports can charge after losses. Its savings are delivered kWh × the rate it avoids, minus (delivered kWh ÷ efficiency) × export credit, plus any program payment. For the combined payback, the calculator adds the battery’s savings for its life only. After that, the solar has to recover the rest alone.
Three simplifications to know about. Upkeep is taken off in year one and then changes at the same rate as savings. Counted year by year instead, the example’s solar payback is 19.2 years if upkeep stays flat and 20.1 if it rises with your rate, so the effect is under a year either way. The battery’s savings also change by q each year, even though a battery doesn’t lose output the way panels do. That is cautious: if its savings rose with your rate alone, its own payback would be about 32 years instead of 35, still past its life. Last, the export credit also rises with q each year, but APS’s RCP credit stays at $0.05554 for 10 years and may change after that. Holding it flat for the first 10 years and raising it with your rate afterwards gives a solar payback of 21.3 years; holding it flat for all 25 years gives 21.9. After the lock, the tariff moves you to the RCP rate in effect then, and APS has cut that rate every year since 2017, from $0.129 to $0.05554, by up to the 10% a year the tariff allows. If your credit is locked, read the result as at least a year or two optimistic.
What moves the answer most
Each row changes one input from the example and leaves the rest alone.
| Change | Solar-only payback | With the battery |
|---|---|---|
| Example as above | 19.8 years | 26.7 years |
| Price $2.25/W (EnergySage’s Arizona quote average) | 15.5 | 22.9 |
| Price $3.36/W (Wood Mackenzie/SEIA national figure) | 21.8 | 28.4 |
| Self-use 25% (low end of LBNL’s range) | 22.4 | 29.9 |
| Self-use 50% (high end) | 16.9 | 23.0 |
| Rates flat (0% a year) | 25.6 | 39.6 |
| Rates up 5% a year | 16.6 | 20.9 |
| No upkeep counted | 16.5 | 22.5 |
| Exports credited at your full rate (classic net metering) | 11.4 | 18.5 (battery never pays back) |
| APS Storage Rewards, using APS’s own $232.10 example | 19.8 | 24.1 (battery alone: 23.0) |
| Battery avoids a 25¢ on-peak rate (an example rate, not APS’s) | 19.8 | 22.8 (battery alone: 19.7) |
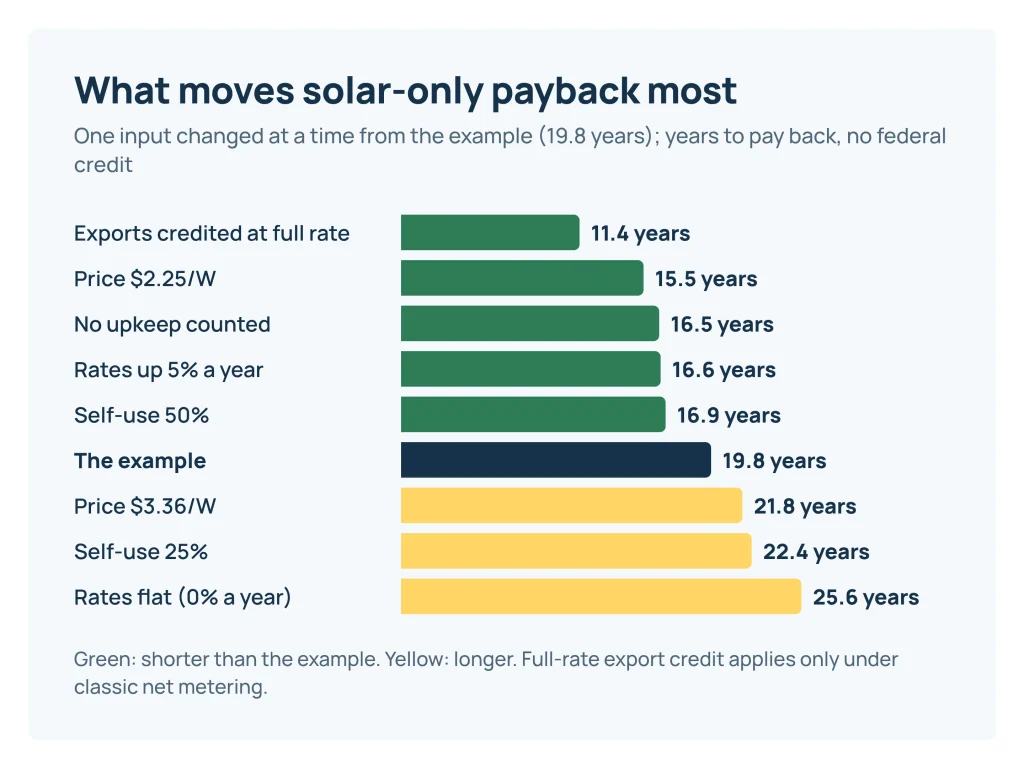
The export credit moves the answer most, then the rate-rise assumption and the price. Under full net metering, every exported kWh already earns your full rate. A battery then only loses energy: about 11% of everything it stores, at 89% efficiency. Pages written before 2026 often show shorter paybacks because they take the ended 30% credit off the price; a cash or loan buyer installing now can’t claim it.
Prices to put in
Use the price on your quote. If you don’t have one yet, these published estimates show the range. They measure different things, and we haven’t averaged them.
| Source and date | Figure | What it measures |
|---|---|---|
| LBNL, August 2026 | $3.0/W known cash purchases; $3.6/W all host-owned; $4.5/W known loan-financed | Medians for home systems installed in 2025, in 2025 dollars, before incentives. Price the owner reported; leases and PPAs excluded. Cash and loan figures cover only the roughly 45% of systems whose financing type is known |
| LBNL, same report | $5.1/W paired with storage vs $3.0/W solar only, cash | Per watt of solar. The $2.1/W gap is about $16,170 on 7.7 kW. About 80% of the paired data come from California |
| Wood Mackenzie/SEIA, Q3 2026 report, 10 Sep 2026 | $3.36/W, Q2 2026 | Modelled national average residential price, built up from component prices and industry interviews; not a quote |
| EnergySage, page updated 30 Jun 2026, state table 30 Oct 2026 | $2.60/W national; Arizona $2.25/W | Average of quotes on its marketplace, before incentives. EnergySage is a commercial quote marketplace |
| EnergySage, updated 13 Jul 2026 | $15,647 for 13.5 kWh | Typical battery price before incentives; its brand and state tables use first-half 2026 quotes. Same marketplace |
Loan-financed systems were priced well above cash purchases, which LBNL says may be partly because loan origination fees are rolled into the up-front price. If you’re financing, the payback here understates your real cost. Our lease, loan or cash calculator adds the interest. For what goes into a battery quote, see what a solar battery costs.
Where the other defaults come from
- Self-use share, 35%: our assumption. An LBNL study (Barbose, Forrester and Miller, 2023) combined metered hourly load from about 1,800 homes across six utilities (2012-2013 data) with modelled solar output. It found that typically sized systems without storage “generally export roughly 50-75%” of their yearly output, so they use 25 to 50% at home. With batteries at the large end of typical sizes, run to maximise self-use, exports fell to about 10 to 30%. A household that runs its appliances in the daytime uses more of its solar as it’s made.
- Output loss, 0.7% a year, and upkeep, $30 per kW a year. NLR’s Annual Technology Baseline 2025 uses 0.7% a year and puts upkeep at $29.83 per kW a year for 2024. That covers insurance, cleaning, vegetation and component failures. It is a full-cost average: in a system’s early years many owners spend far less, and a repair such as a new inverter can come as one larger bill.
- Rate rise, 2.5% a year: our assumption. EIA’s October 2026 Short-Term Energy Outlook has the US average residential price going from 18.2 cents in 2026 to 18.7 cents in 2027, about 2.7%. Nobody publishes a 25-year forecast for your utility, so try 0% and 5%.
- Battery efficiency, 89%. The Powerwall 3 datasheet gives 89% from solar to battery to home. Enphase’s IQ Battery 10C datasheet gives 90% AC round trip and FranklinWH’s aPower 2 datasheet gives 90% grid to battery to load. Use your own battery’s datasheet.
- Average capacity, 80%, and 330 days a year: our assumptions. Tesla warrants 70% capacity after 10 years and FranklinWH 70% at 15 years or 60 MWh, so the average over a battery’s life is well below 100%. In a cloudy winter the battery won’t fill from solar, so use fewer days.
- Battery life, 15 years. NLR’s 2024 baseline for home batteries assumes 15 years. Tesla’s warranty runs 10 years; Enphase’s and FranklinWH’s run 15.
When a battery pays, and when it doesn’t
On export credits alone, a battery earns the gap between your rate and your export credit, less its losses. In the example that’s about 9 cents per kWh delivered, which is too little to recover $15,647 in 15 years. Three things can change that:
- A time-of-use rate. If your plan charges much more in the late afternoon and evening, enter that on-peak rate as “Rate the battery avoids”. Take it from your bill or your utility’s tariff, not from an installer’s slide.
- A utility battery program. APS Storage Rewards, a five-year pilot, pays $110 per average kW your battery supplies over the season; on 4 November 2026 the page offered a waitlist rather than direct sign-up. The season runs 1 May to 31 October, with up to 60 conservation days of usually one to four hours, often between 4 and 10 pm. APS’s own example, 2.11 kW on average, earns $232.10. Programs in other states pay very different amounts and some are closed (as of 3 November 2026): see battery rebates and programs by state. Enter only what a program’s own terms say, and treat it as an estimate.
- Backup. The calculator puts no dollar value on keeping the lights on in an outage, because that value is yours to judge. If backup is the reason you want a battery, read the battery’s payback as the cost of that insurance.
The LBNL study is useful here from the grid’s side too. It found that under net billing with flat rates, batteries used to soak up a home’s own solar gave the power system “approximately zero” market value. With hourly prices, and batteries also allowed to discharge to the grid up to the solar’s nameplate size, that rose to roughly 50 to 70% of the most they could be worth, mostly from a small number of high-priced hours.
Why there’s no tax credit in this math
The 30% residential clean energy credit under 25D covered solar and batteries of at least 3 kWh. It “shall not apply with respect to any expenditures made after December 31, 2025” (25D(h), added by Public Law 119-21). Under 25D(e)(8), an expenditure counts as made when installation is completed. The IRS FAQ (FS-2025-05) adds that paying in 2025 doesn’t help if installation was completed later. The IRS credit page still mentions a phase-out in 2033. The statute is what applies, and it ended the credit at the end of 2025.
A lease or PPA company may be able to claim a business credit under 48E on the system it owns, but you can’t. Whether any of that value reaches you depends on the contract. Our guide to what ended and what’s left in 2026 covers the detail. This is general information, not tax advice: a tax professional decides what applies to you.
Checking a quote’s payback claim
An installer’s payback figure is a claim. Enter the quote’s own numbers here, and ask for these in writing:
- The first-year production estimate, with the tilt, direction, shading and losses behind it. Compare it with a PVWatts run for your address.
- The export credit and rate plan the payback assumes. If it values every exported kWh at your full rate, ask your utility whether that applies to new customers.
- The yearly rate rise assumed. In the example, 5% a year instead of 2.5% cuts payback from 19.8 to 16.6 years, so ask what the figure is based on.
- Whether any federal credit has been taken off the price. For a system you own and that is installed in 2026, none applies.
- Whether upkeep, inverter replacement and battery replacement are counted.
- For a battery: usable kWh, round-trip efficiency and the warranty’s end capacity and years. Some warranties require an internet connection. Tesla’s warranty says it will honour at least 4 years if the Powerwall is offline for an extended period or isn’t registered, and FranklinWH’s falls to 4 years if the system stays offline more than 90 consecutive days and isn’t reconnected. Read the warranty itself.
- Program payments counted in the payback, with the program’s name and a link to its terms.
If you’re still deciding whether to go solar at all, start with whether solar is worth it without the tax credit.
What this calculator leaves out
- Hourly pricing. Under California’s Net Billing Tariff, as SCE’s tariff sets it out, export credits vary by hour, by weekday or weekend, and by month. A single average credit is a rough stand-in. For time-of-use plans, our time-of-use battery calculator goes further.
- Fixed, demand and minimum charges. None are modelled. Check your rate plan for monthly fixed charges, demand charges and minimum bills.
- Financing and the time value of money. Payback here is simple cash payback, with no interest or discounting.
- Replacements. No inverter or battery replacement is added. The combined payback counts one battery for its life.
- Home value, insurance changes and permit fees that aren’t already in your quote.
Treat the results as estimates. Your utility’s tariff sets your rates and credits, the program’s terms set any payments, and a tax professional decides what applies to your taxes.
Sources and notes
Leaf & Watt doesn’t sell or install solar or batteries and takes no fees from installers, lenders or makers. Products are named only where their datasheets are the source of a figure, and naming one isn’t a recommendation. PVWatts figures come from our own runs with the settings stated above. EIA figures are state averages, not tariff rates. The APS export rate and Storage Rewards terms are APS’s own, and they apply only to APS customers. How we build estimates is on our how we estimate page. This page is general information, not professional, tax or legal advice.
Sources checked on 4 November 2026.
Formulas and sources
- Solar output, first year: NLR PVWatts v8 (API 8.5.0), runs of 4 November 2026
- Solar used at home as it is made: LBNL, Barbose, Forrester and Miller: Implications of Battery Storage for Solar Net-Metering Reforms (IEEE PVSC, 2023)
- Solar exported to the grid: APS Rate Rider RCP, effective 1 September 2026 (ACC Decision 82122): exports metered instantaneously
- Yearly change in savings: NLR Annual Technology Baseline 2025: residential PV (0.7%/yr degradation; fixed O&M $29.83/kW-yr for 2024)
- Solar bill savings, first year: APS Rate Rider RCP, effective 1 September 2026 (ACC Decision 82122): exports metered instantaneously
- Solar upkeep, first year: NLR Annual Technology Baseline 2025: residential PV (0.7%/yr degradation; fixed O&M $29.83/kW-yr for 2024)
- Solar savings after upkeep, first year: Arithmetic on the reader's own entries, no outside figure
- Solar price after rebates: LBNL U.S. Distributed Solar and Storage 2026 Data Update, August 2026 (median cash-purchase price $3.0/W, 2025 installs)
- Round-trip efficiency as a share: Tesla Powerwall 3 datasheet: 13.5 kWh, 89% solar to battery to home
- Battery energy delivered to the house a year: Tesla Powerwall 3 datasheet: 13.5 kWh, 89% solar to battery to home
- Battery savings, first year: Arithmetic on the reader's own entries, no outside figure
- Battery price after rebates: Arithmetic on the reader's own entries, no outside figure
- Solar exported with the battery: Arithmetic on the reader's own entries, no outside figure
- Share of solar used at home with the battery: LBNL, Barbose, Forrester and Miller: Implications of Battery Storage for Solar Net-Metering Reforms (IEEE PVSC, 2023)
- Solar-only payback: Arithmetic on the reader's own entries, no outside figure
- Battery's own payback: Arithmetic on the reader's own entries, no outside figure
- Solar and battery price: Arithmetic on the reader's own entries, no outside figure
- Solar and battery savings, first year: Arithmetic on the reader's own entries, no outside figure
- Sum of yearly growth factors over the battery's life: Arithmetic on the reader's own entries, no outside figure
- Combined savings over the battery's life: Arithmetic on the reader's own entries, no outside figure
- Combined payback if reached within the battery's life: Arithmetic on the reader's own entries, no outside figure
- Price left to recover when the battery ends: Arithmetic on the reader's own entries, no outside figure
- Solar savings in the year after the battery ends: Arithmetic on the reader's own entries, no outside figure
- Years of solar alone to recover the rest: Arithmetic on the reader's own entries, no outside figure
- Payback, solar plus battery: Arithmetic on the reader's own entries, no outside figure
- Sum of yearly growth factors over the years compared: Arithmetic on the reader's own entries, no outside figure
- Solar net gain over the years compared: Arithmetic on the reader's own entries, no outside figure
- Battery net gain over its life: Arithmetic on the reader's own entries, no outside figure
Sources
- 26 U.S.C. 25D, residential clean energy credit (Cornell LII)
- EIA Electric Power Monthly Table 5.6.B, average residential price year to date (released 23 October 2026)
- EIA Electric Sales, Revenue and Average Price, Table 5A: residential average monthly bill, 2024
- APS Rate Rider RCP, effective 1 September 2026 (ACC Decision 82122)
- NLR PVWatts Calculator (v8)
- LBNL: U.S. Distributed Solar and Storage, 2026 Data Update (August 2026)
- Wood Mackenzie and SEIA: US Solar Market Insight Q3 2026
- EnergySage: solar panel cost by state (quote marketplace; state table updated 30 October 2026)
- EnergySage: how much do batteries cost (quote marketplace; updated 13 July 2026)
- LBNL: Barbose, Forrester and Miller, Implications of Battery Storage for Solar Net-Metering Reforms (IEEE PVSC, 2023)
- NLR Annual Technology Baseline 2025: residential PV
- EIA Short-Term Energy Outlook, October 2026: electricity
- Tesla Powerwall 3 datasheet
- NLR Annual Technology Baseline 2024: residential battery storage
- APS Storage Rewards
- IRS FS-2025-05: FAQs on sections 25C, 25D and others under Public Law 119-21 (21 August 2025)
- Tesla Powerwall warranty (US), Rev 2.6, 6 May 2026
- FranklinWH aPower 2 datasheet
- FranklinWH limited warranty for end users (effective 28 October 2026)
- Enphase IQ Battery 10C datasheet (DSH-00565-10.0)
- SCE Net Billing Tariff schedule (export value structure)
- 26 U.S.C. 48E, clean electricity investment credit (Cornell LII)