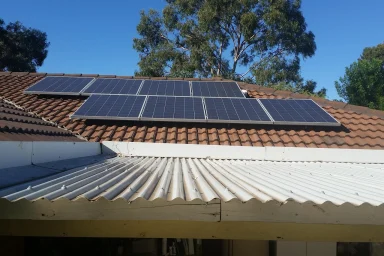
Without the federal tax credit, home solar still pays for itself in most of the places we’ve worked out, only more slowly. On our numbers, an 8 kW system bought for cash pays back in about 5 to 12 years in eight of nine US cities if every kilowatt-hour it makes is worth the full retail price; Seattle takes 16. Where the utility pays little for the power you send back, it took roughly 9 to 20 years in our examples. A battery bought for bill savings alone rarely earns back its price. This section shows the prices, the arithmetic and the state rules behind those numbers, so you can redo them with your own bill and your own quote.
Read it in order if you’re starting from scratch: whether solar pays at all, what panels cost, your own payback, what a battery adds, then your state. Leaf & Watt sells, installs and finances nothing, and takes no fees from installers.
General information, not professional, tax, legal or financial advice. Prices are published estimates and our own worked examples, not quotes. Your utility sets export credits, and a tax professional decides what applies to your taxes.
The numbers at a glance
| Question | Short answer, before incentives |
|---|---|
| Solar price per watt | EnergySage quote average $2.60 national; Wood Mackenzie/SEIA modelled $3.36 (Q2 2026); Berkeley Lab installer medians $2.4 to $6.3 (2025 installs) |
| Payback, 8 kW for cash, no credit | About 5 to 12 years in eight of nine cities at full retail value; longer where exports earn little |
| One home battery, installed | EnergySage average $15,647 for 13.5 kWh (first half of 2026); our build-up $13,957 for 10 kWh |
| Texas | About $2.25 per watt on EnergySage’s quotes; payback in our Houston example from about 10 years to 20 or more |
| California | EnergySage average $2.52 per watt; about 11 years on our SCE example under net billing, against 4.6 at full retail |
| Federal homeowner credit | None for a system you own that is installed after 31 December 2025 |
Is solar worth it for your house?
Three things decide the answer: what you pay for the system, what your utility credits for the power you export, and whether you pay cash. The tax credit is no longer one of them for a system you own. Simple payback is the installed price divided by the first-year savings. For Miami at full retail: 8 kW × 1,550 kWh per kW = 12,400 kWh a year, worth 12,400 × $0.1532 = $1,900, so $16,960 ÷ $1,900 = 8.9 years.
Solar without the credit tends to pay off where power is expensive, exports earn close to retail, the roof is unshaded and sound, you pay cash, and you’ll stay longer than the payback. It struggles where power is cheap and the sun is weak, or where a dealer-fee loan inflates the price. Our guide to whether solar panels are worth it without the tax credit works this out city by city, with loans, 25-year totals and what solar does to home value.
Why older payback figures look better
Through 2025, homeowners could take 30% of a system’s cost off their federal income tax. Public Law 119-21 ended that: the credit “shall not apply with respect to any expenditures made after December 31, 2025” (26 USC 25D(h)), and an expenditure counts as made when installation is completed. The IRS FAQ adds that paying in 2025 doesn’t help if installation finished later. Batteries a homeowner owns fall under the same cut-off.
Some cost pages and quotes still take 30% off, which makes payback look about 30% shorter than what a buyer gets today. A lease or PPA company may still be able to claim a business credit under section 48E on the system it owns; that’s the provider’s credit, not yours, and whether any of it reaches you is a contract question. Our rates, rules and incentives guides cover the credit change and state programs in detail.
What solar panels cost
No single price is “the” price. We show three kinds of figure side by side and don’t average them: marketplace quote averages (EnergySage), an industry cost model (Wood Mackenzie with SEIA) and a national lab’s data on prices homeowners reported (Berkeley Lab’s 2026 data update). Then we build a price up from dated retail parts, BLS wages and labelled assumptions. How we estimate explains the method.
The spread between installers is wider than the spread between sources: Berkeley Lab found median prices across the top 100 home installers ran from $2.4 to $6.3 per watt in 2025, so a second and third quote can matter more than any average. Financing shows up in the price too: Berkeley Lab found loan-financed systems were “considerably higher priced” than cash purchases, possibly in part because loan fees are rolled into the up-front price. Ask for the cash price and the loan price side by side.
Export credits move payback the most
Panels make most of their power at midday, when many homes use little, and what the utility pays for that surplus often matters more than the panel price. There is no national rule. A few we read: Florida’s investor-owned utilities credit excess energy against the next month’s use, APS in Arizona pays $0.05554 per exported kWh for applications from 1 September 2026 to 31 August 2027, and California’s large utilities pay hourly export prices under net billing. On a Phoenix system that uses half its output at home and exports the rest at the APS rate (our assumed split), payback stretches from 8.4 years to 12.3.
Run your own payback
The solar payback calculator takes your rate, yearly use, export credit and quote, with or without a battery. For your rate, divide the energy charges on a year of bills by the kWh used and leave out the fixed monthly charge, because solar doesn’t reduce it. For production, run NLR’s PVWatts for your own address and roof.
Its default example, a 7.7 kW system at $3.00 a watt in the Phoenix area on APS’s export rate, pays back in about 19.8 years with no credit. The same inputs show what moves the answer: full-rate net metering cuts it to 11.4 years, rates rising 5% a year instead of 2.5% cut it to 16.6, and flat rates stretch it to 25.6. Enter an installer’s numbers too, and ask about any gap.
What a battery adds
One battery of about 13.5 kWh averages about $15,600 in EnergySage’s installed quotes, and no federal credit applies to one you buy and have installed in 2026. Our guide to what a solar battery costs installed puts the published figures side by side, builds a 10 kWh price up line by line and works out the cost per kWh a battery actually delivers: about 31 cents for a Powerwall 3 at EnergySage’s average if it cycles fully once a day for its 10-year warranty.
Set that against what a stored kWh saves. In the APS example, storing midday solar for the evening instead of exporting it saves about 9 cents per kWh after losses, so on export credits alone the battery in our calculator example would need about 35 years to pay back, more than twice its assumed 15-year life. What changes the math is a time-of-use rate with a wide gap between peak and off-peak or export prices, a utility battery program, or backup you’re willing to pay for. Our batteries and backup guides cover sizing and backup.
Costs in your state
State pages combine local prices, wages, export rules and incentives.
Texas
EnergySage’s Texas quotes average about $2.25 per watt, and our build-up from retail parts and Texas wages lands at $19,602 for 8.8 kW. We found no statewide net metering rule: in competitive areas your retail plan decides what exports earn, and each plan states it on its Electricity Facts Label. Austin Energy credits all production at its Value of Solar rate of 12.89¢ per kWh and offers a $4,000 rebate for eligible systems. A 2025 law gives buyers five business days to cancel a solar contract. Our page on the cost of solar panels in Texas works payback for competitive plans, Austin Energy and CPS Energy.
California
California publishes what homeowners report paying through California DG Stats, and those figures run above marketplace averages. Under net billing, our SCE example’s daytime exports earn about 5.9¢ per kWh in 2026, against 24¢ to 26¢ to buy power at the same hours, which is why payback is about 11 years instead of 4.6. The property tax exclusion for new solar covers systems completed before 1 January 2027 unless it is extended. Our guide to solar panel cost in California has the utility-by-utility data, a build-up and a battery section.
Before you sign a quote
- System size in kW DC, the panel and inverter models, and the price per watt (total price ÷ watts).
- The cash price, and separately the loan price with any dealer fee shown.
- A production estimate for your roof, with the tool and assumptions behind it. Compare it with your own PVWatts run.
- The export tariff or retail plan the savings assume, and the rate used. Check it against your utility’s tariff.
- No federal tax credit in the savings for a system you own installed in 2026.
- Any battery’s usable kWh, warranty years and end-of-warranty capacity.
- Panel, inverter and workmanship warranties, and the price to remove and reinstall panels if the roof needs replacing.
- Who handles the permit, inspection and utility interconnection. Don’t let a system be switched on before they’re complete; a licensed installer or electrician does the wiring.
If you’re weighing a lease or PPA instead of buying, our lease, loan or cash guides compare the contracts.
Figures come from the guides linked above, where each is cited in full. Prices, rates and programs change, so check them against your own quotes and your utility’s tariff. Sources checked on 4 November 2026.