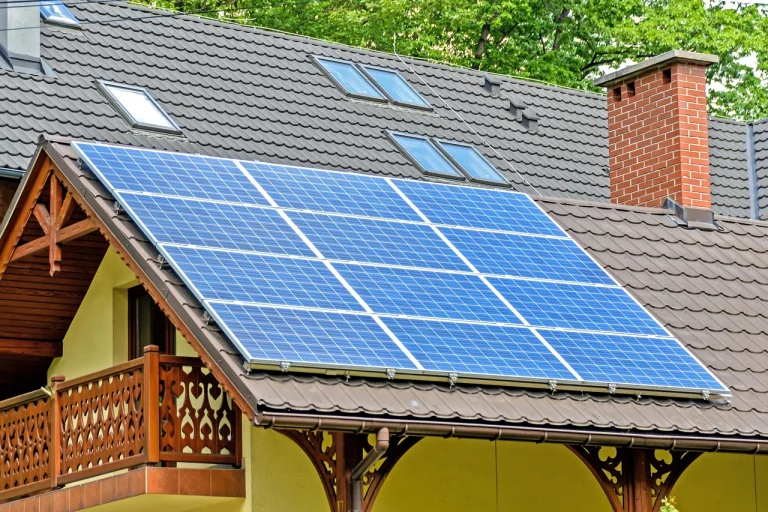
An average US home needs about 14 to 23 solar panels of 430 watts to cover a year of electricity, depending on where it is. That range comes from EIA’s 2024 average of 863 kWh a month per home and from NLR’s PVWatts output for nine US cities. The answer for your own home depends on three numbers: your yearly use in kWh, how much one kW of panels makes on your roof, and the wattage of the panel on your quote. The calculator on this page takes those three numbers, and the sections below show the math, what changes it, and when covering 100% of your use isn’t the right target. More sizing guides are in our sizing and output hub.
The math, worked through
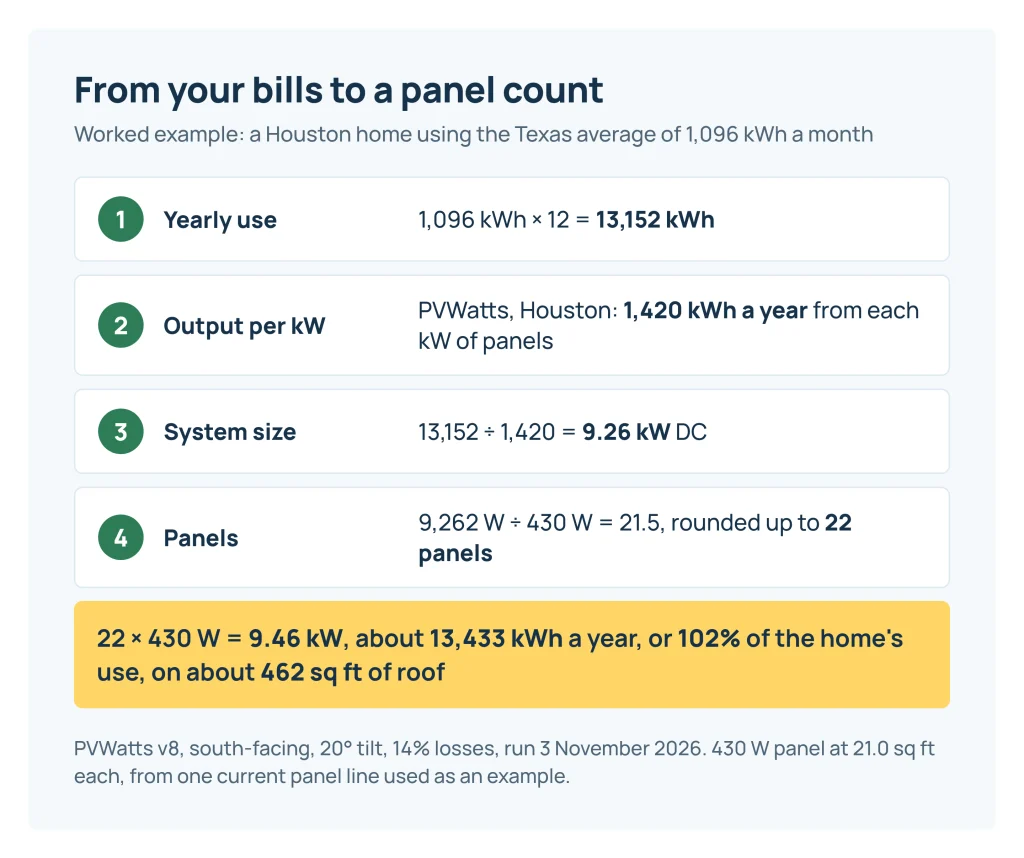
Four steps, using the calculator’s default example: a home in Houston that uses the Texas average of 1,096 kWh a month, which is EIA’s 2024 figure per residential customer (Table 5A).
- Yearly use. 1,096 kWh × 12 = 13,152 kWh.
- Output per kW. NLR’s PVWatts estimates 1,420 kWh a year from each kW of panels in Houston (south-facing, 20° tilt, 14% losses; our run on 3 November 2026).
- System size. 13,152 ÷ 1,420 = 9.26 kW of panels, measured in DC watts as panels are rated.
- Panels. 9,262 W ÷ 430 W = 21.5, rounded up to 22 panels. That makes 9.46 kW, which PVWatts puts at about 13,433 kWh a year, or 102% of the home’s use.
In one line: panels = yearly kWh × share to cover ÷ (kWh per kW × panel watts ÷ 1,000), rounded up. The 22 panels would cover about 462 square feet of roof, at 21.0 square feet each. The 430 W rating and that size come from the Qcells Q.TRON BLK M-G2+ product page, one current residential panel line at 415 to 440 W and 67.8 × 44.6 inches. We use it as an example, not a recommendation. Put the panel from your own quote into the calculator.
Panels needed by yearly use and city
The table uses 430 W panels, covers 100% of yearly use, and assumes a south-facing roof at 20° with PVWatts’ default losses. Find your yearly kWh on your bills, then the city with sun most like yours.
| City (kWh per kW a year) | 6,000 kWh | 9,000 kWh | 12,000 kWh | 15,000 kWh | 18,000 kWh |
|---|---|---|---|---|---|
| Phoenix (1,754) | 8 | 12 | 16 | 20 | 24 |
| Los Angeles (1,676) | 9 | 13 | 17 | 21 | 25 |
| Denver (1,594) | 9 | 14 | 18 | 22 | 27 |
| Miami (1,550) | 10 | 14 | 19 | 23 | 28 |
| Houston (1,420) | 10 | 15 | 20 | 25 | 30 |
| Raleigh (1,378) | 11 | 16 | 21 | 26 | 31 |
| Chicago (1,307) | 11 | 17 | 22 | 27 | 33 |
| Boston (1,301) | 11 | 17 | 22 | 27 | 33 |
| Seattle (1,087) | 13 | 20 | 26 | 33 | 39 |
For the US average of 863 kWh a month (about 10,360 kWh a year), the same method gives 14 panels in Phoenix, 17 in Houston, 19 in Chicago and Boston, and 23 in Seattle. The systems people actually install fall in a similar range. Berkeley Lab’s 2026 distributed solar data update (August 2026) puts the median US home system installed in 2025 at 7.7 kW, with most between roughly 5 and 12 kW. California, about half of the sample, had a relatively small median size.
Step 1: get your real yearly use
Add up the kWh on your last 12 bills. Many bills and online accounts also show a 12-month usage history. One summer or winter bill times 12 can be far off, because air conditioning and electric heat move use a lot by season.
State averages are a rough guide only. EIA’s 2024 figures per home range from 495 kWh a month in Hawaii and 503 in California to 1,096 in Texas, 1,104 in Florida and 1,202 in Louisiana. These count electricity bought from the grid, so in states with a lot of rooftop solar they run low. EIA noted in May 2025 that many Hawaii homes have solar panels, which cuts their grid use.
If your bill shows dollars, not kWh
Take off the fixed monthly customer charge, then divide by your price per kWh. A $160 bill with a $10 fixed charge at $0.15 per kWh is (160 − 10) ÷ 0.15 = 1,000 kWh. This is less accurate than reading the kWh. Tiered and time-of-use rates mean no single price fits every kWh, and taxes and riders blur it further. The calculator’s default rate of $0.160 is EIA’s Texas average for January to August 2026, an average of all charges rather than a tariff rate.
Add what you plan to add
The Qcells line above carries a 25-year product and performance warranty, so size for the house you’ll have over that time. For an electric car, multiply the miles you drive a year by the kWh per 100 miles on the car’s fueleconomy.gov label, then divide by 100. As an example, 12,000 miles in a car rated 30 kWh per 100 miles is 3,600 kWh a year. In Houston that adds about 2.5 kW, or 6 more 430 W panels. For a heat pump, ask the installer for the expected yearly kWh from their load calculation. Don’t guess it from a rule of thumb.
Some utilities hold you to this. Southern California Edison’s net billing tariff (Schedule NBT, sheet 87683-E, effective 15 February 2024) caps a system’s estimated output at 150% of your previous year’s use if you have 12 months of billing history. If the system would make more than your past use, you must attest that it’s sized for the extra use you expect within 12 months; new customers must attest to their expected use.
Step 2: output per kW, from PVWatts
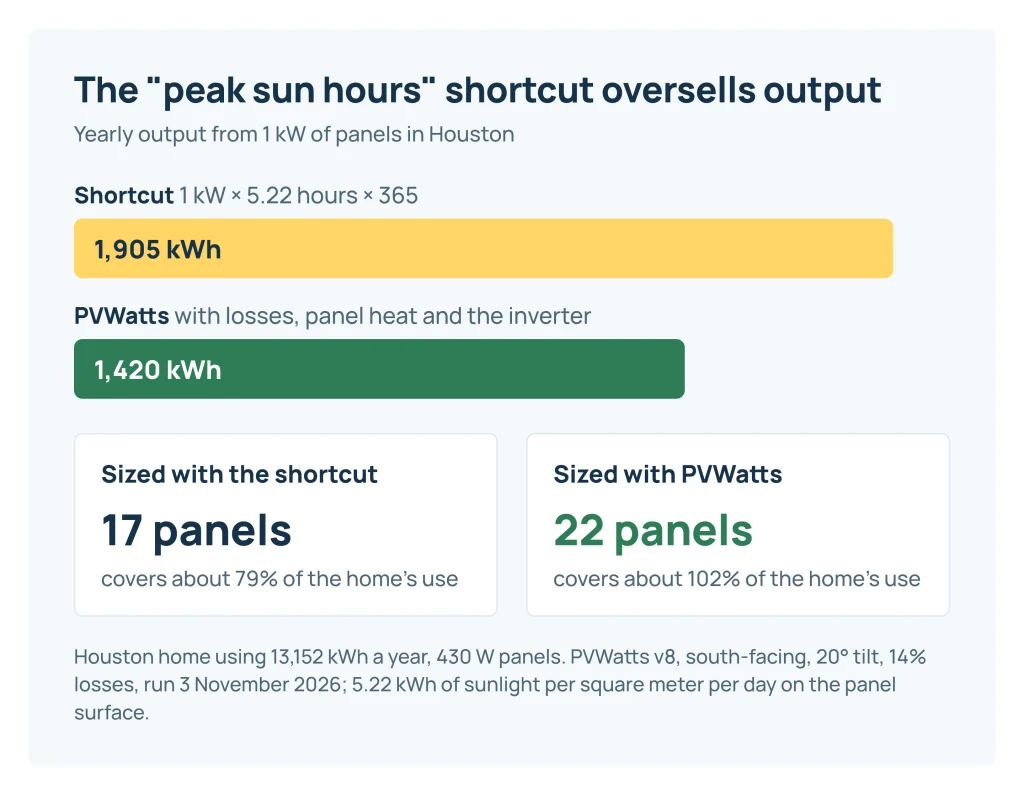
A common shortcut multiplies panel watts by “peak sun hours” and stops there. That leaves out real losses. PVWatts’ default of 14% covers soiling (2%), shading (3%), mismatch (2%), wiring (2%), connections (0.5%), light-induced degradation (1.5%), nameplate rating (1%) and availability (3%), multiplied together, as listed in the PVWatts manual (NREL, 2014). PVWatts also models panel heat and the inverter on top of that.
The gap is large. Our Houston run shows 5.22 kWh of sunlight per square meter per day on the panel surface. The shortcut would turn that into 1 kW × 5.22 hours × 365 = 1,905 kWh per kW a year. PVWatts’ figure is 1,420, about a quarter less (our arithmetic). Sized with the shortcut, the Houston home would get 17 panels instead of 22 and cover about 79% of its use.
To get your own figure, run PVWatts (pvwatts.nlr.gov, linked above) for your address with a system size of 1 kW and your roof’s tilt and direction. Then pick “My own PVWatts or quote figure” in the calculator and enter the yearly kWh it gives. You can do the same with a quote: its estimated yearly kWh divided by its kW DC is the figure the installer assumed. If it’s well above your own PVWatts run for the same roof, ask why in writing.
Roof direction, tilt and shade
The city figures assume a south-facing roof at 20° with only PVWatts’ default 3% shading. An east- or west-facing roof makes less per kW, and so does a tree that shades the roof in the afternoon. The calculator’s “roof and shade adjustment” lets you scale the city figure down. It’s our assumption, so a PVWatts run for your own roof is better. To see how much tilt matters where you live, use our solar panel tilt angle calculator.
Roof space is the other limit. Berkeley Lab’s data for 2025 installs show panels typically covering 16% to 39% of a home’s total roof area, with a median of 22% on single-story homes and 31% on multi-story homes. Only the planes that get good sun count. Vents, chimneys and skylights take space, and local fire and building codes may require clear paths and setbacks at ridges and edges. Your building department and the installer’s layout decide how many panels fit. If they can’t fit what the calculator asks for, higher-wattage panels can close part of the gap. Otherwise, plan to cover less than 100%.
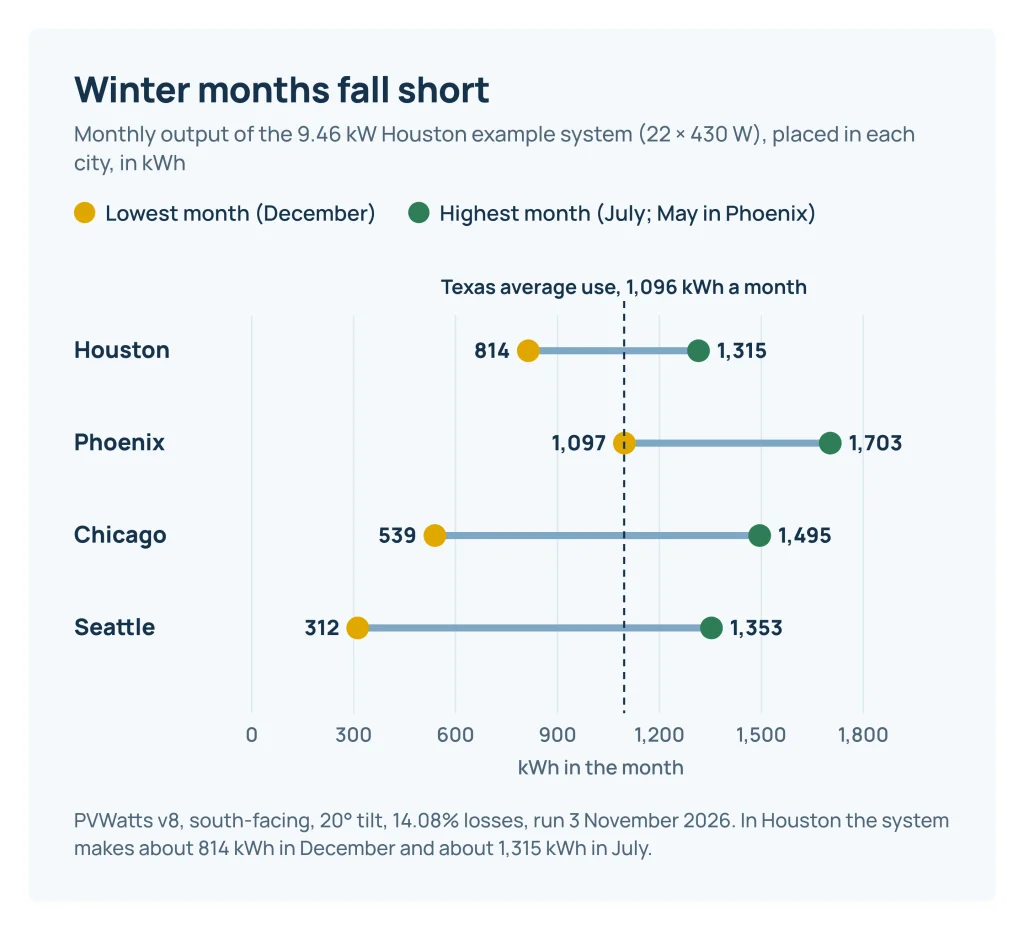
Winter months fall short
A system sized for the year makes more than you use in summer and less in winter. The calculator shows the lowest and highest month for the city you pick. PVWatts’ monthly output per kW, from the same runs:
| City | Lowest month (kWh per kW) | Highest month (kWh per kW) | Example system, lowest month | Example system, highest month |
|---|---|---|---|---|
| Houston | 86 (December) | 139 (July) | 814 kWh | 1,315 kWh |
| Phoenix | 116 (December) | 180 (May) | 1,097 kWh | 1,703 kWh |
| Chicago | 57 (December) | 158 (July) | 539 kWh | 1,495 kWh |
| Seattle | 33 (December) | 143 (July) | 312 kWh | 1,353 kWh |
In Houston, that system makes about 814 kWh in December against average use of 1,096 kWh, and about 1,315 kWh in July. Whether the summer surplus pays for the winter shortfall depends on your export rules, which is the next question.
How much of your use to cover
Covering 100% of yearly use makes sense when each kWh you send to the grid earns about what a kWh from the grid costs. Where exports earn less, the last panels you add are worth less than the first ones. Some examples of how this varies (our net metering guide covers more):
- Florida investor-owned utilities. Under PSC Rule 25-6.065, excess energy is credited to the next month’s bill, and credits can carry forward for up to 12 months. Credits still unused at the end of the calendar year are paid out at an average annual rate based on the utility’s as-available energy tariff (COG-1), not your retail rate. So a summer surplus still unused at year end earns that rate rather than what you pay per kWh. To qualify for expedited interconnection under the rule, a system’s gross power rating may not exceed 90% of the customer’s distribution service rating; Tier 1 is 10 kW or less. The rule applies to investor-owned utilities, not municipal utilities or co-ops.
- California investor-owned utilities. New systems go on the net billing tariff. Under the SCE tariff linked above, exports are credited at hourly avoided-cost prices that change by month, weekday and hour, not at your retail rate. So how much of your solar you use as it’s made, or store in a battery, matters as much as the yearly total. Our California NEM 3.0 guide covers it.
- Texas. We found no statewide net metering rule. In competitive areas the export credit depends on your retail electricity plan, while city-owned utilities such as Austin Energy and CPS Energy, and electric co-ops, set their own. Check the buyback terms on your plan’s Electricity Facts Label before you size for exports.
If exports earn much less than your rate, try 70% or 80% in the calculator and compare. The solar payback calculator shows what each size saves at your export rate. If you’re considering a battery, size it next with the home battery size calculator. Berkeley Lab found that 37% of new home systems in 2025 were installed with storage, with a median battery of 13.5 kWh.
What that size costs, roughly
Prices are quoted per watt, so a size in kW converts directly into published estimates. These are not quotes. Each measures something different, and we don’t average them. Applied to the 9.46 kW example (our arithmetic):
| Published estimate | What it measures | Per watt | 9.46 kW system |
|---|---|---|---|
| EnergySage, Texas (state table updated 30 Oct 2026) | Average quote on its marketplace, before incentives. EnergySage is a commercial quote marketplace | $2.25 | $21,285 |
| EnergySage, US average (same page) | Same, national | $2.60 | $24,596 |
| Wood Mackenzie / SEIA, Q2 2026 | Modelled national average residential system price, built bottom-up from component prices and industry interviews | $3.36 | $31,786 |
| Berkeley Lab, 2025 installs | Range of median prices across the top 100 residential installers, systems the owner bought | $2.40 to $6.30 | $22,704 to $59,598 |
No federal tax credit lowers these for a system you own. The 30% homeowner credit doesn’t apply to expenditures made after 31 December 2025 (26 USC 25D(h)), and an expenditure counts as made when installation is completed. Our 2026 solar tax credit guide explains what’s left, including the credit lease and PPA providers may still claim.
Checking the size on a quote
- The use it’s based on. Did the installer use your 12 months of kWh, and did they add loads you didn’t mention? Ask for the number.
- kW DC and kW AC. Panels are rated in DC and inverters in AC. PVWatts’ default DC-to-AC ratio is 1.2, so a 9.46 kW DC system might have about 7.9 kW of inverter capacity. SCE’s sizing cap uses the CEC-AC rating. Make sure you’re comparing like with like.
- The production estimate. Yearly kWh, the tool used, and the shading, tilt and direction assumed. Divide it by kW DC and compare with your own PVWatts run.
- Panel model and count. The quote should name the panel model and its wattage. Count × watts should equal the system size.
- The export assumption. Which tariff or retail plan the savings assume, and at what credit per kWh.
- Degradation. Panels lose some output each year. The Qcells line above warrants at least 98.5% of rated power in year one, then no more than 0.33% loss a year, to 90.58% at 25 years. The calculator sizes for year one, so a few percent above 100% leaves room for this.
Panel, inverter and battery wiring is work for a licensed electrician or installer. The system needs the permits and inspections your area requires, plus the utility’s interconnection approval, before it’s switched on.
What this calculator can’t tell you
- How many panels fit on your roof, after setbacks, vents and shade. That takes a site visit or a layout from the installer.
- Your exact output. The city profiles are city-centre runs on typical-year weather. Real years vary, and so does your roof.
- The best size for your money. That depends on your rate plan, export credit and price per watt, which the payback calculator handles.
- Whether your utility will accept the size. Your utility’s interconnection rules and tariff decide that.
Sources and notes
Production figures come from our NLR PVWatts v8 runs for city centres (1 kW DC, standard module, fixed roof mount, 20° tilt, due south, 14.08% losses, NSRDB typical-year weather). Your roof’s direction, tilt and shade will change them. Use figures come from EIA’s 2024 Table 5A, and the panel example from Qcells’ product page. The roof adjustment and the 0 default for fixed charges and added use are our assumptions. Prices are published estimates, shown side by side and not averaged. How we estimate explains our method. Leaf & Watt sells and installs nothing and takes no referral fees. Your utility decides export credits and size limits, and a tax professional can say what applies to your taxes. This page is general information, not professional, tax, legal or financial advice.
Sources checked on 4 November 2026.
Formulas and sources
- Average monthly use: EIA, 2024 Average Monthly Bill – Residential (Table 5A, released 7 Oct 2025)
- Yearly use counted: EIA, 2024 Average Monthly Bill – Residential (Table 5A, released 7 Oct 2025)
- Solar target per year: SCE Schedule NBT, Special Condition on sizing (Cal. PUC Sheet 87683-E, effective 15 Feb 2024)
- Yearly output per kW, profile: NLR PVWatts v8 API, 1 kW DC, standard module, fixed roof mount, 20° tilt, south, 14.08% losses, NSRDB TMY (Leaf & Watt run, 3 Nov 2026)
- Yearly output per kW, adjusted: NREL PVWatts Version 5 Manual (NREL/TP-6A20-62641, Sept 2014): output scales with DC nameplate
- System size needed: NREL PVWatts Version 5 Manual (NREL/TP-6A20-62641, Sept 2014): output scales with DC nameplate
- Number of panels: Qcells Q.TRON BLK M-G2+ product page: 415-440 Wp, 67.8 x 44.6 in
- Size with whole panels: Qcells Q.TRON BLK M-G2+ product page: 415-440 Wp, 67.8 x 44.6 in
- Estimated yearly output: NREL PVWatts Version 5 Manual (NREL/TP-6A20-62641, Sept 2014): output scales with DC nameplate
- Share of yearly use covered: NREL PVWatts Version 5 Manual (NREL/TP-6A20-62641, Sept 2014): output scales with DC nameplate
- Panel area: Qcells Q.TRON BLK M-G2+ product page: 415-440 Wp, 67.8 x 44.6 in
- Lowest month's output: NLR PVWatts v8 API, 1 kW DC, standard module, fixed roof mount, 20° tilt, south, 14.08% losses, NSRDB TMY (Leaf & Watt run, 3 Nov 2026)
- Highest month's output: NLR PVWatts v8 API, 1 kW DC, standard module, fixed roof mount, 20° tilt, south, 14.08% losses, NSRDB TMY (Leaf & Watt run, 3 Nov 2026)
- Phoenix AZ: yearly output per kW DC (kWh) (1754, as of 2026-11-03): NLR PVWatts v8 API, 1 kW DC, standard module, fixed roof mount, 20° tilt, south, 14.08% losses, NSRDB TMY (Leaf & Watt run, 3 Nov 2026)
- Phoenix AZ: lowest month's output per kW DC (kWh) (116, as of 2026-11-03): NLR PVWatts v8 API, 1 kW DC, standard module, fixed roof mount, 20° tilt, south, 14.08% losses, NSRDB TMY (Leaf & Watt run, 3 Nov 2026)
- Phoenix AZ: highest month's output per kW DC (kWh) (180, as of 2026-11-03): NLR PVWatts v8 API, 1 kW DC, standard module, fixed roof mount, 20° tilt, south, 14.08% losses, NSRDB TMY (Leaf & Watt run, 3 Nov 2026)
- Los Angeles CA: yearly output per kW DC (kWh) (1676, as of 2026-11-03): NLR PVWatts v8 API, 1 kW DC, standard module, fixed roof mount, 20° tilt, south, 14.08% losses, NSRDB TMY (Leaf & Watt run, 3 Nov 2026)
- Los Angeles CA: lowest month's output per kW DC (kWh) (100, as of 2026-11-03): NLR PVWatts v8 API, 1 kW DC, standard module, fixed roof mount, 20° tilt, south, 14.08% losses, NSRDB TMY (Leaf & Watt run, 3 Nov 2026)
- Los Angeles CA: highest month's output per kW DC (kWh) (173, as of 2026-11-03): NLR PVWatts v8 API, 1 kW DC, standard module, fixed roof mount, 20° tilt, south, 14.08% losses, NSRDB TMY (Leaf & Watt run, 3 Nov 2026)
- Denver CO: yearly output per kW DC (kWh) (1594, as of 2026-11-03): NLR PVWatts v8 API, 1 kW DC, standard module, fixed roof mount, 20° tilt, south, 14.08% losses, NSRDB TMY (Leaf & Watt run, 3 Nov 2026)
- Denver CO: lowest month's output per kW DC (kWh) (96, as of 2026-11-03): NLR PVWatts v8 API, 1 kW DC, standard module, fixed roof mount, 20° tilt, south, 14.08% losses, NSRDB TMY (Leaf & Watt run, 3 Nov 2026)
- Denver CO: highest month's output per kW DC (kWh) (159, as of 2026-11-03): NLR PVWatts v8 API, 1 kW DC, standard module, fixed roof mount, 20° tilt, south, 14.08% losses, NSRDB TMY (Leaf & Watt run, 3 Nov 2026)
- Miami FL: yearly output per kW DC (kWh) (1550, as of 2026-11-03): NLR PVWatts v8 API, 1 kW DC, standard module, fixed roof mount, 20° tilt, south, 14.08% losses, NSRDB TMY (Leaf & Watt run, 3 Nov 2026)
- Miami FL: lowest month's output per kW DC (kWh) (109, as of 2026-11-03): NLR PVWatts v8 API, 1 kW DC, standard module, fixed roof mount, 20° tilt, south, 14.08% losses, NSRDB TMY (Leaf & Watt run, 3 Nov 2026)
- Miami FL: highest month's output per kW DC (kWh) (152, as of 2026-11-03): NLR PVWatts v8 API, 1 kW DC, standard module, fixed roof mount, 20° tilt, south, 14.08% losses, NSRDB TMY (Leaf & Watt run, 3 Nov 2026)
- Houston TX: yearly output per kW DC (kWh) (1420, as of 2026-11-03): NLR PVWatts v8 API, 1 kW DC, standard module, fixed roof mount, 20° tilt, south, 14.08% losses, NSRDB TMY (Leaf & Watt run, 3 Nov 2026)
- Houston TX: lowest month's output per kW DC (kWh) (86, as of 2026-11-03): NLR PVWatts v8 API, 1 kW DC, standard module, fixed roof mount, 20° tilt, south, 14.08% losses, NSRDB TMY (Leaf & Watt run, 3 Nov 2026)
- Houston TX: highest month's output per kW DC (kWh) (139, as of 2026-11-03): NLR PVWatts v8 API, 1 kW DC, standard module, fixed roof mount, 20° tilt, south, 14.08% losses, NSRDB TMY (Leaf & Watt run, 3 Nov 2026)
- Raleigh NC: yearly output per kW DC (kWh) (1378, as of 2026-11-03): NLR PVWatts v8 API, 1 kW DC, standard module, fixed roof mount, 20° tilt, south, 14.08% losses, NSRDB TMY (Leaf & Watt run, 3 Nov 2026)
- Raleigh NC: lowest month's output per kW DC (kWh) (79, as of 2026-11-03): NLR PVWatts v8 API, 1 kW DC, standard module, fixed roof mount, 20° tilt, south, 14.08% losses, NSRDB TMY (Leaf & Watt run, 3 Nov 2026)
- Raleigh NC: highest month's output per kW DC (kWh) (136, as of 2026-11-03): NLR PVWatts v8 API, 1 kW DC, standard module, fixed roof mount, 20° tilt, south, 14.08% losses, NSRDB TMY (Leaf & Watt run, 3 Nov 2026)
- Chicago IL: yearly output per kW DC (kWh) (1307, as of 2026-11-03): NLR PVWatts v8 API, 1 kW DC, standard module, fixed roof mount, 20° tilt, south, 14.08% losses, NSRDB TMY (Leaf & Watt run, 3 Nov 2026)
- Chicago IL: lowest month's output per kW DC (kWh) (57, as of 2026-11-03): NLR PVWatts v8 API, 1 kW DC, standard module, fixed roof mount, 20° tilt, south, 14.08% losses, NSRDB TMY (Leaf & Watt run, 3 Nov 2026)
- Chicago IL: highest month's output per kW DC (kWh) (158, as of 2026-11-03): NLR PVWatts v8 API, 1 kW DC, standard module, fixed roof mount, 20° tilt, south, 14.08% losses, NSRDB TMY (Leaf & Watt run, 3 Nov 2026)
- Boston MA: yearly output per kW DC (kWh) (1301, as of 2026-11-03): NLR PVWatts v8 API, 1 kW DC, standard module, fixed roof mount, 20° tilt, south, 14.08% losses, NSRDB TMY (Leaf & Watt run, 3 Nov 2026)
- Boston MA: lowest month's output per kW DC (kWh) (59, as of 2026-11-03): NLR PVWatts v8 API, 1 kW DC, standard module, fixed roof mount, 20° tilt, south, 14.08% losses, NSRDB TMY (Leaf & Watt run, 3 Nov 2026)
- Boston MA: highest month's output per kW DC (kWh) (143, as of 2026-11-03): NLR PVWatts v8 API, 1 kW DC, standard module, fixed roof mount, 20° tilt, south, 14.08% losses, NSRDB TMY (Leaf & Watt run, 3 Nov 2026)
- Seattle WA: yearly output per kW DC (kWh) (1087, as of 2026-11-03): NLR PVWatts v8 API, 1 kW DC, standard module, fixed roof mount, 20° tilt, south, 14.08% losses, NSRDB TMY (Leaf & Watt run, 3 Nov 2026)
- Seattle WA: lowest month's output per kW DC (kWh) (33, as of 2026-11-03): NLR PVWatts v8 API, 1 kW DC, standard module, fixed roof mount, 20° tilt, south, 14.08% losses, NSRDB TMY (Leaf & Watt run, 3 Nov 2026)
- Seattle WA: highest month's output per kW DC (kWh) (143, as of 2026-11-03): NLR PVWatts v8 API, 1 kW DC, standard module, fixed roof mount, 20° tilt, south, 14.08% losses, NSRDB TMY (Leaf & Watt run, 3 Nov 2026)
Sources
- EIA: 2024 Average Monthly Bill – Residential, Table 5A (released 7 Oct 2025)
- EIA Today in Energy: average residential bills and use in 2024 (12 May 2025)
- EIA Electric Power Monthly Table 5.6.B, average price year to date (released 23 Oct 2026)
- NLR PVWatts Calculator (v8 runs, 3 Nov 2026)
- NREL: PVWatts Version 5 Manual, NREL/TP-6A20-62641 (Sept 2014)
- Berkeley Lab: U.S. Distributed Solar and Storage, 2026 Data Update (Aug 2026)
- Qcells: Q.TRON BLK M-G2+ product page (specs and warranty)
- fueleconomy.gov: Learn more about the electric vehicle label
- Southern California Edison: Schedule NBT, Net Billing Tariff (sizing, sheet 87683-E, effective 15 Feb 2024)
- Florida Administrative Code Rule 25-6.065, Interconnection and Net Metering of Customer-Owned Renewable Generation
- EnergySage: Solar panel cost by state (state table updated 30 Oct 2026; commercial quote marketplace)
- SEIA / Wood Mackenzie: Solar Market Insight Report Q3 2026
- 26 U.S. Code 25D, Residential clean energy credit (Cornell LII)